


In Africa, the gender gap in access to financial services is driven by women entrepreneurs’ own self-perception. Such perception leaves many African women on the fringes of the financial sector—unable to save, borrow, or build capital. Worldwide, women’s access to finance is disproportionately low.
In the 10 years leading up to 2021, the share of women in sub-Saharan Africa who owned a financial account more than doubled to reach 49%, according to data from the Global Findex. Since 2017 alone, account ownership rates for women in the region increased 12 percentage points, driven entirely by increased adoption of mobile money accounts.
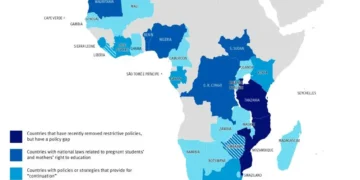
South Africa tops the ranking of African countries according to the level of women’s financial inclusion, according to the “African Women’s Inclusion Index 2025” recently published by the African Centre for Economic Transformation (ACET). This index is based on data from 2022, the last year for which statistics are available for the majority of countries on the continent.
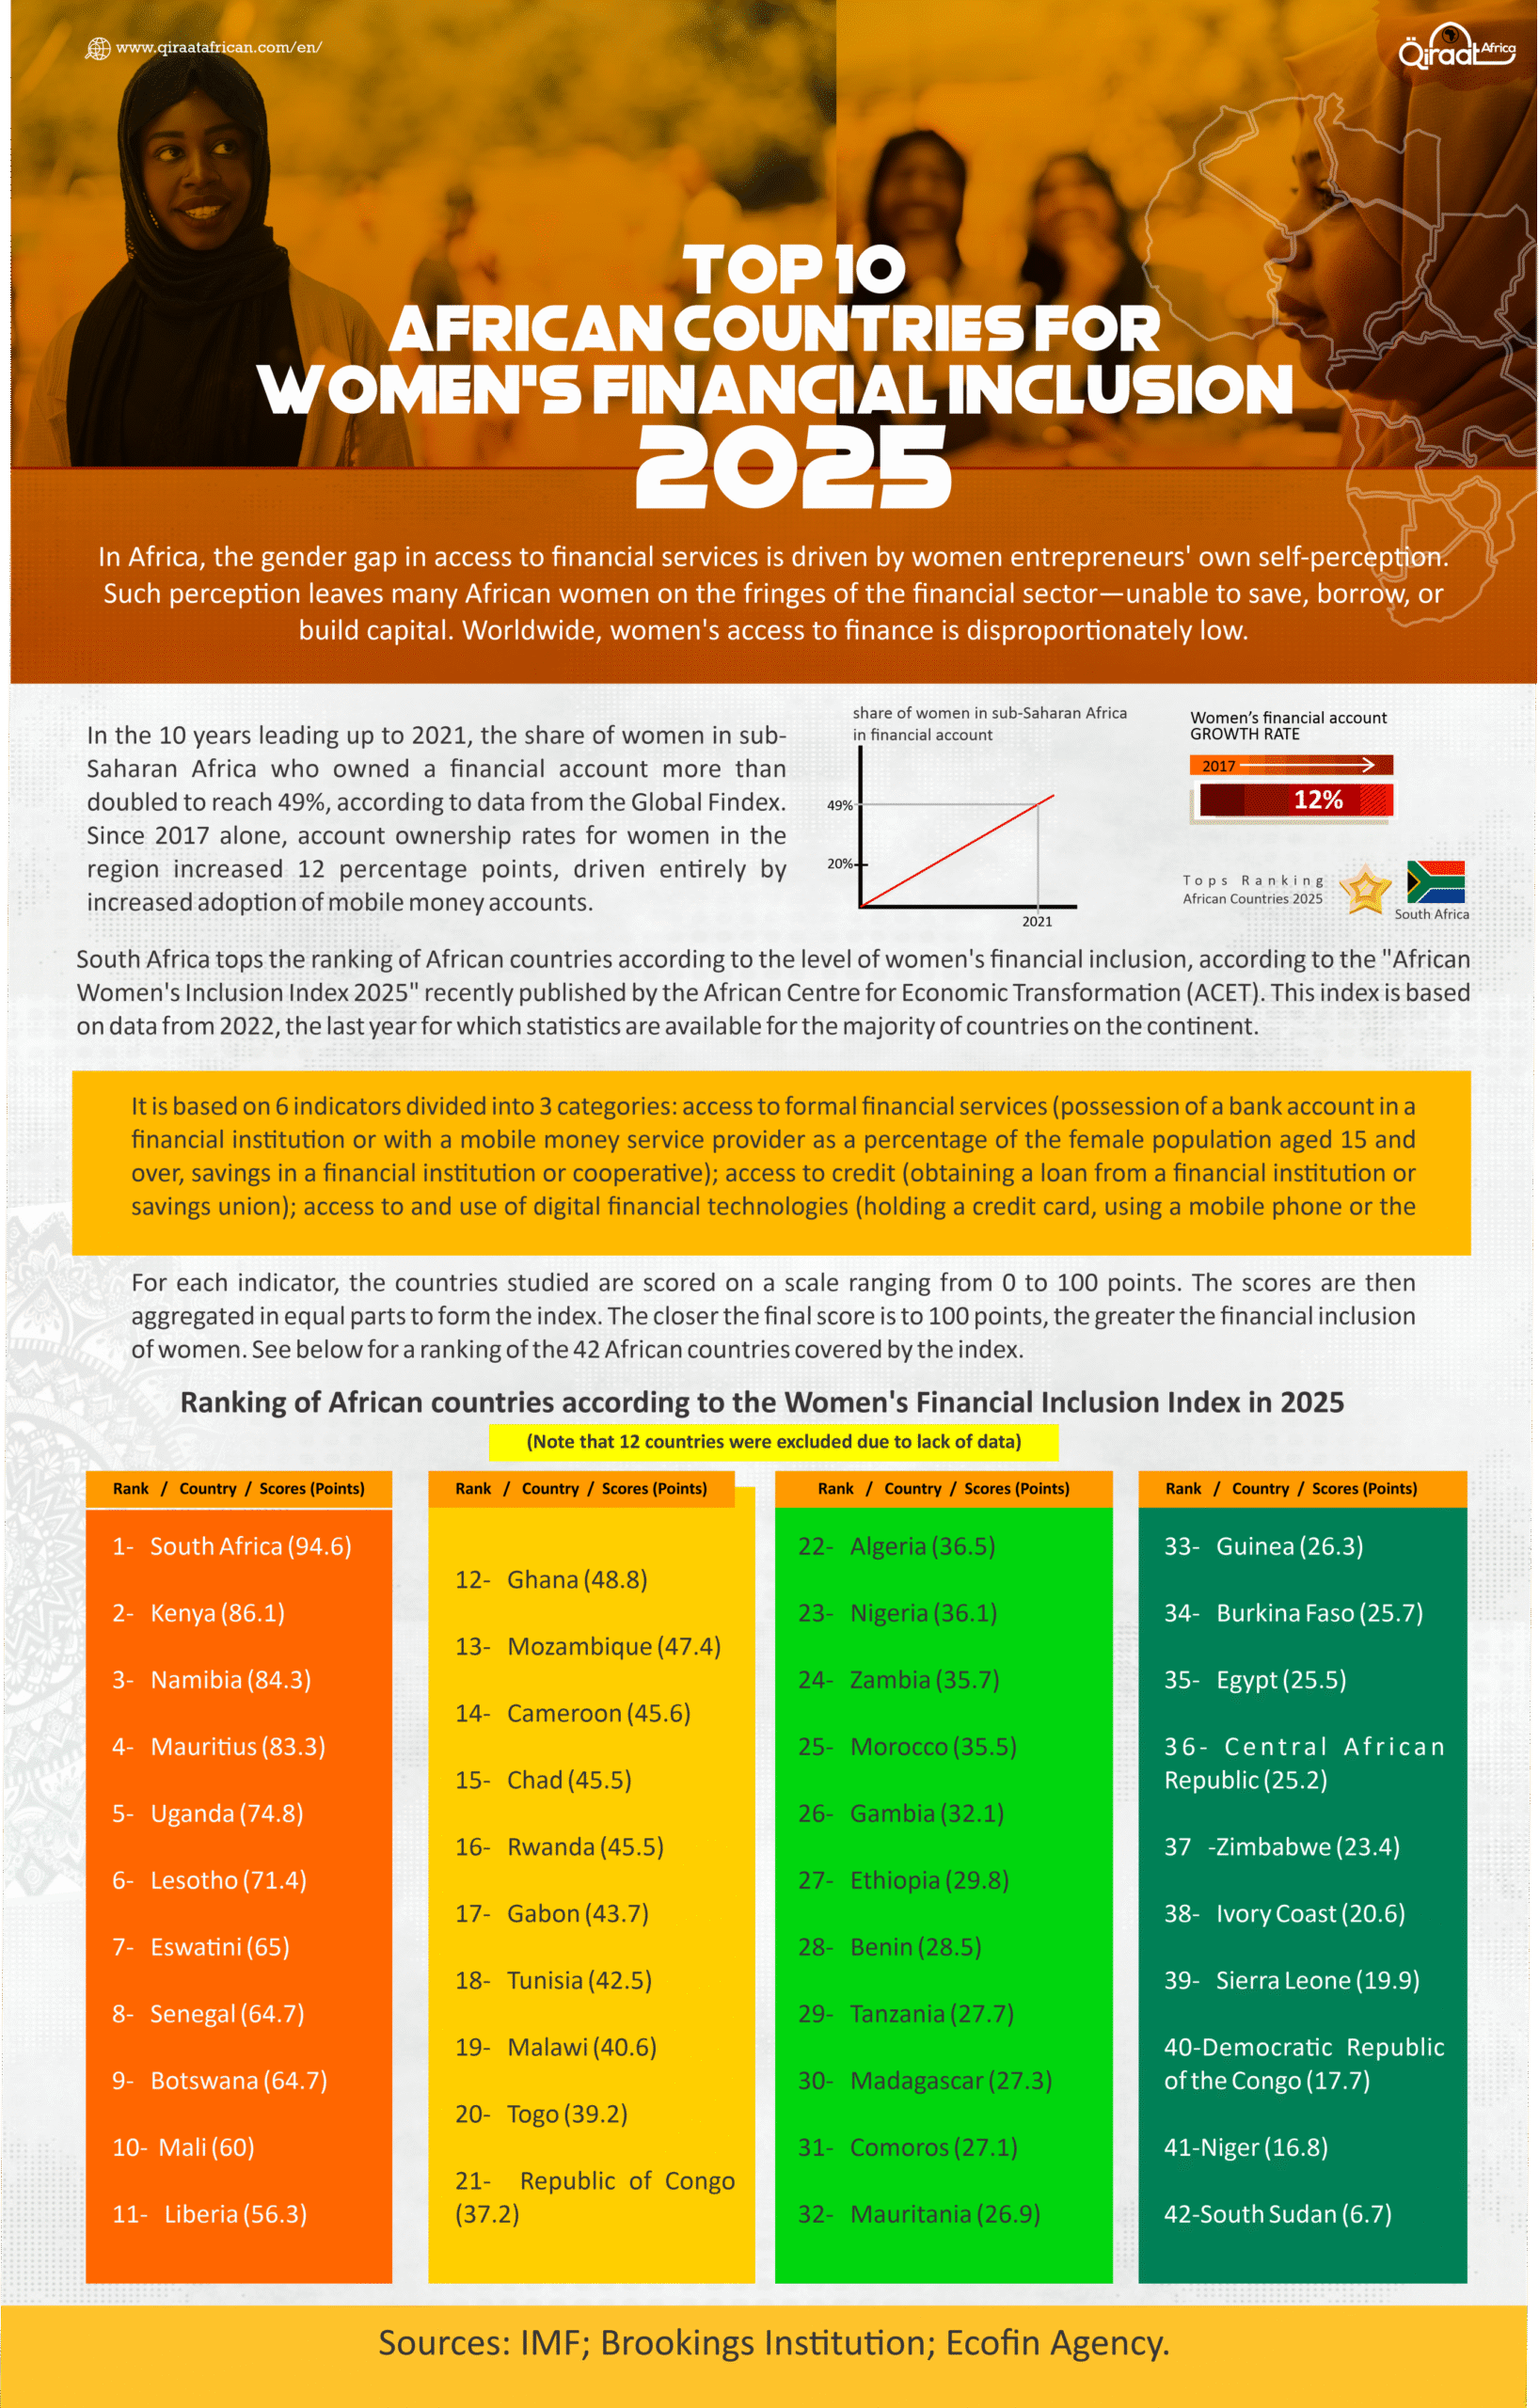
It is based on 6 indicators divided into 3 categories: access to formal financial services (possession of a bank account in a financial institution or with a mobile money service provider as a percentage of the female population aged 15 and over, savings in a financial institution or cooperative); access to credit (obtaining a loan from a financial institution or savings union); access to and use of digital financial technologies (holding a credit card, using a mobile phone or the Internet to purchase a good or service).
For each indicator, the countries studied are scored on a scale ranging from 0 to 100 points. The scores are then aggregated in equal parts to form the index. The closer the final score is to 100 points, the greater the financial inclusion of women. See below for a ranking of the 42 African countries covered by the index.
Ranking of African countries according to the Women’s Financial Inclusion Index in 2025
(Note that 12 countries were excluded due to lack of data.)
| Rank – Country Scores (Points) |
| 1-South Africa (94.6) |
| 2-Kenya (86.1) |
| 3-Namibia (84.3) |
| 4-Mauritius (83.3) |
| 5-Uganda (74.8) |
| 6-Lesotho (71.4) |
| 7-Eswatini (65) |
| 8-Senegal (64.7) |
| -Botswana (64.7) |
| 10-Mali (60) |
| 11-Liberia (56.3) |
| 12-Ghana (48.8) |
| 13-Mozambique (47.4) |
| 14-Cameroon (45.6) |
| 15-Chad (45.5) |
| -Rwanda (45.5) |
| 17-Gabon (43.7) |
| 18-Tunisia (42.5) |
| 19-Malawi (40.6) |
| 20-Togo (39.2) |
| 21-Republic of Congo (37.2) |
| 22-Algeria (36.5) |
| 23-Nigeria (36.1) |
| 24-Zambia (35.7) |
| 25-Morocco (35.5) |
| 26-Gambia (32.1) |
| 27-Ethiopia (29.8) |
| 28-Benin (28.5) |
| 29-Tanzania (27.7) |
| 30-Madagascar (27.3) |
| 31-Comoros (27.1) |
| 32-Mauritania (26.9) |
| 33-Guinea (26.3) |
| 34-Burkina Faso (25.7) |
| 35-Egypt (25.5) |
| 36-Central African Republic (25.2) |
| 37-Zimbabwe (23.4) |
| 38-Ivory Coast (20.6) |
| 39-Sierra Leone (19.9) |
| 40-Democratic Republic of the Congo (17.7) |
| 41-Niger (16.8) |
| 42-South Sudan (6.7) |
ــــــــــــــــــــــــــ
* Sources: IMF; Brookings Institution; Ecofin Agency.


